Draw and Measure tools and their icons
Add point | Draws a point on the map for each click of the mouse button. |
Add line | From a starting point, each click on the map defines the beginning and end point of a segment of the line. You must double-click the left mouse button to complete the line. |
Trace a freehand line | Click and hold the left mouse button and move the mouse where you want the line to be drawn. Release the left mouse button to finish. |
Add polygon | Each time you click on the map a vertex or corner will be added. Think of a polygon as a rubber band and each time you click on the map you are gluing the rubber band to that point on the map. When you are drawing a polygon it is best to draw in a clockwise rotation. You must double-click the left mouse button to complete the polygon. |
Trace a freehand polygon | From your starting point, after you press the left mouse button down on the map at the start, hold it down and move the mouse around the map. The polygon is drawn following the mouse location until the left mouse button is released. |
Add a rectangle | Draws a rectangle area or polygon - usually from a top-left corner to a bottom-right corner (hold down the mouse to start and let go to finish). |
Add text | Writes text on your map in the position you choose by using a mouse click with the left button. |
Add a triangle | Draws a triangular area polygon – click and drag and let go of the mouse to finish. |
Add an arrow | Draws an arrow area polygon – click and drag and let go of the mouse to finish. |
Add a circle polygon | Draws a circular area polygon – click and drag and let go of the mouse to finish. |
How to create geometry
Point Feature
Step 1: Open the
Draw and Measure tool from the tools menu.

Step 2: Choose the
point option.

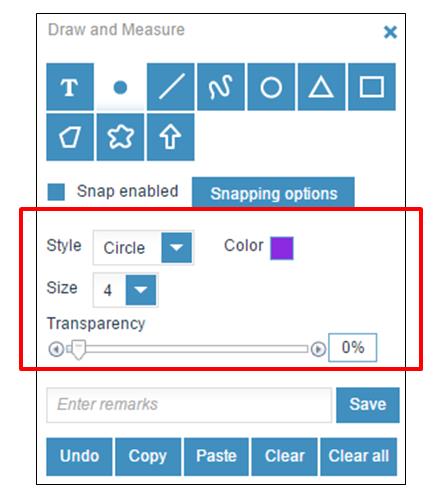
Step 3: Choose your Style, Colour, Size and Transparency.
Step 4 (optional): Enter a remark. This remark will appear as an attribute on the shape.
Step 5: If you want the point feature to snap to existing features in the map, then click the
Snapping options button to set the snapping. Select which layers of the map you want to include in snapping.
Step 6: After you are satisfied with the settings for your drawing, create points on the map by a single left click of the mouse. You will need to re-click the tool for each graphic you create.
Lines Feature
Step 1: Select the
line option from the draw and measure tool.

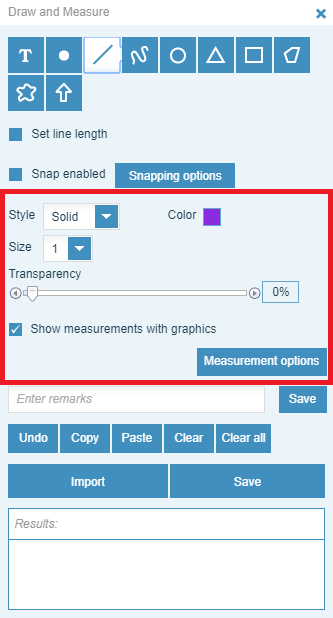
Step 2: Select your
Style, Colour and Size options and tick
'Show measurements with Graphics' if you want to see the length.
Step 3 (optional): Check the set line length box if you want to define how long the line will be.
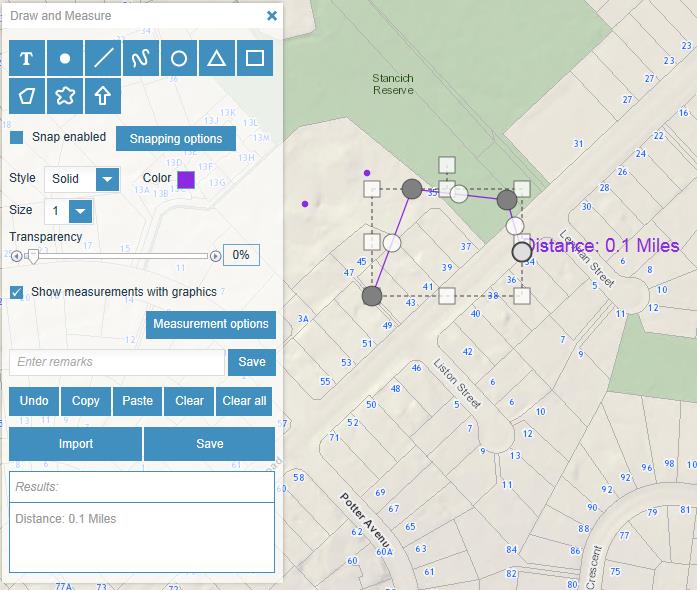
Step 4: After you are satisfied with the settings for your drawing, create points on the map by single left click of the mouse.
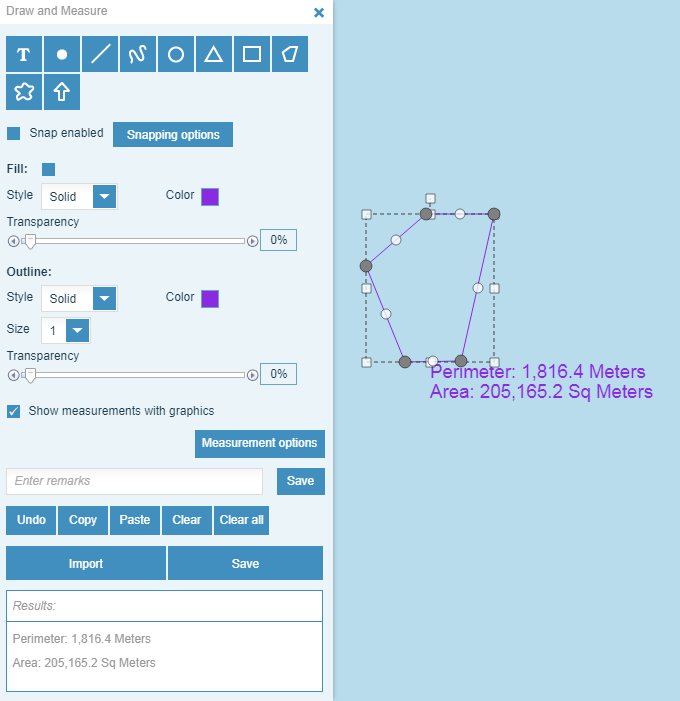
The graphic will appear with the vertices in dark grey, and the mid-point between in white circles. The Distance will appear if you have checked the Show Measurements with graphics check.
Polygons
Step 1: Select the polygon option from the draw and measure tool.

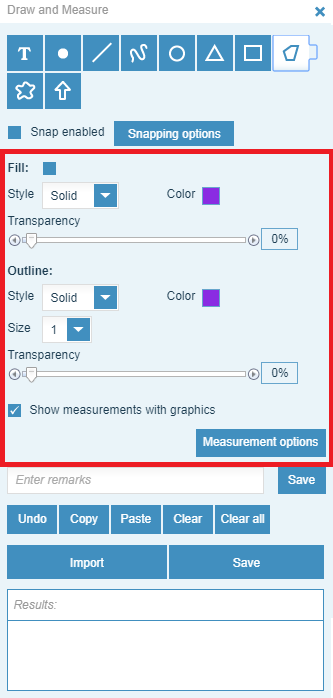
Step 2: Select your
style, colour (fill and outline) and
size options, and tick "show measurements with graphics" if you want to see the area and perimeter.
Step 3: After you are satisfied with the settings for your polygon, create the vertices on the map by clicking the mouse once.
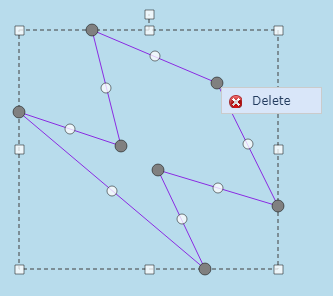
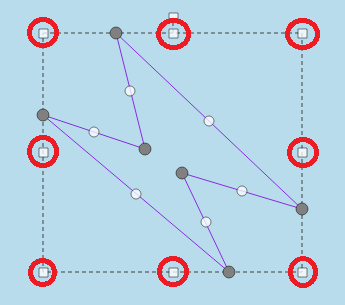
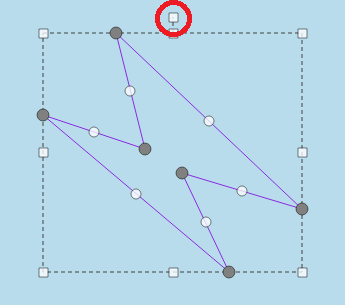
How to reshape graphics
Step 1: Right click on a vertex and select “Delete” if you wish to delete it.
Step 2: Click on one of the square symbols on the square border of the graphic to enlarge.
Step 3: Click and move the square symbol above the image to rotate.
Step 4: Click on an area outside the graphic to remove edit handles.
Add fixed shape sizes
Step 1: Choose either
straight line, circle or square.
Step 2: Check the set line length/radius/width and height box
Step 3: Enter the line length, radius, or width and height, depending on the shape.
Step 4: Click on the map to draw.
How to add text
Step 1: Select the text option on the Draw and Measure tool.

Step 2: Choose the Style, Colour, Size, Font, Alignment and Angle. Your settings will remain the same for the remainder of the GeoMaps session unless you change them.
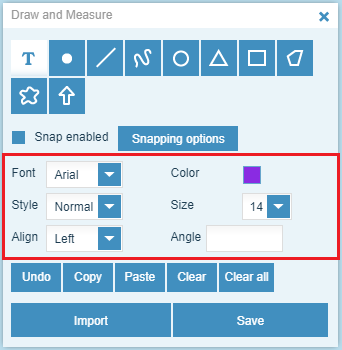
Step 3: Create text on the map by single left click of the mouse to start. You will need to re-click the tool for each graphic you create.
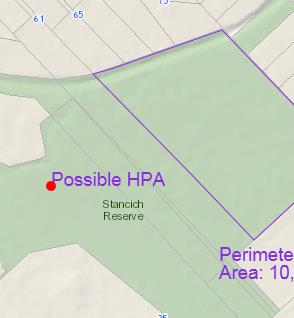
Step 4: The graphic will appear with the anchor as a red point.
Import your graphic
You can save graphics that you have used in a previous session and use them again with the Import function.
Step 1: Draw a shape on the map using the Draw and Measure tool.
Step 2: Save the shape as a fileformat.mpk
Step 3: Upload this file back into GeoMaps using the Import button.
